 GBR
GBR Franck Hertz Experiment to Obtain Curve
| ✅ Paper Type: Free Essay | ✅ Subject: Physics |
| ✅ Wordcount: 1900 words | ✅ Published: 18th May 2020 |
FRANCK-HERTZ EXPERIMENT
ABSTRACT
The Franck Hertz experiment was conducted to obtain a Franck Hertz curve of mercury from the electron impact with mercury vapour at 210 oC. From this, discrete energy levels can be identified and used to create a Franck Hertz curve.
The Franck Hertz curve was obtained by using a RIGOL DS1052E digital oscilloscope to record values in an X-Y format while the acceleration voltages were sweeping between 10.5 V and 73.0 V. This gave an excitation energy of 4.88 V +,- 0.05 V and a resultant photon emission of 254.5 nm +,- 2.69 nm.
INTRODUCTION
J. Franck and G. Hertz were the first to successfully demonstrate through experiment, the quantized nature of matter, in the form of ionisation potential of an atom. The ionisation energy is the energy required to knock an atomic electron out of orbit.
At the University of Berlin in 1914, both J. Franck and G. Hertz were able to measure the ionisation energies of gases at ordinary temperatures.[1] This was done by using a heating filament to produce accelerated kinetic electrons that passed through a variable potential difference, V1, between the filament and a grid, G1. These electrons were decelerated before reaching the collector plate by another greater potential difference, V2, between then grid, G1, and the collector plate, C.[2] This would force the electrons to collide with the atoms of gas but not continue enough to reach the collector plate. If they were accelerated with enough energy, they could ionize the gas via collisions and the generated ions would reach the collector plate and register a current. This allows the ionization potential to be equal to the voltage, V1, in which a current was first registered. Using this Franck and Hertz were able to measure the ionization potentials for a range of gases.
To do this experiment for metals, they were heated to temperatures that would vaporise them. This could cause a range of errors in small current measurements which caused the change in apparatus to negate these affects.
From their experiment they found a value of 4.9 V for the ionization potential of mercury which released a photon with wavelength 254nm with an energy of 4.84 V.[1]
For this experiment, the tube is heated to 210 oC, and consists of an indirectly heated cathode, C1, two grids, G1 and G2, spaced by a distance L, and an anode, A. A variable voltage U1 is used between the cathode and G1 to produce electrons which are accelerated between the grids G1 and G2 from a voltage U2. This is where the electrons gain energy to create either inelastic or elastic collisions with the mercury atoms. A retarding voltage U3 is applied between G2 and the anode, A, to stop any electrons that have undergone inelastic collisions from reaching A. For this experiment U3 is set to 0.4 V so that only electrons with velocity greater than zero, at A, pass through the grid spacing.
If you need assistance with writing your essay, our professional essay writing service is here to help!
Essay Writing ServiceWhen the electron energy is greater than U3, the electrons reach the anode, A, which will induce a current, I. Any electrons that have an energy less than U3 do not reach the anode and are collected by G2. As U2 is increased, it reaches a potential which is great enough to cause the electrons to have enough energy to excite the atoms causing the anode current to drop causing a minimum due to majority of electrons undergoing an inelastic collision. This will cause an emission of photons which can be visible near G2 in the tube.[2] The kinetic energy of these electrons can be calculated with the equation,
eV0 = ½ mv02
Increasing U2 further, a second excitation level can be found, causing a second minima to occur. The kinetic energy of these electrons can be calculated with the equation,
eV0 = ½ mv12
This can be repeated by increasing U2 gradually to find the multiple excitation levels of mercury.[1]
It was assumed that the minima and maxima spacings in the experiment were all equally spaced and correspond to the excitation energy of atoms. It also allowed the magnitude of the first excitation energy can be calculated from the mean value of the minima or maxima spacings. These range from 4.8 – 5.1 eV dependent on the pressure in the tube and the measured number of spacings. These higher values for the lowest excitation energy, compared to the expected 4.67 eV, can be attributed to the first to second transition ,4.89 eV, or the second to third transition, 5.46 eV. It is not apparent that the spacings are not actually equal, although the spacings as functions of the orders of the maxima or minima are visible.[2]
METHOD AND MATERIALS
Materials:
- Heating Oven
- Franck Hertz Tube Assembly
- RIGOL DS1052E digital oscilloscope
- U8482130 Franck-Hertz tube control unit
Method
The heating oven was preheated to 210 oC. A RIGOL DS1052E digital oscilloscope was attached to the U8482130 Franck-Hertz tube control unit as seen in figure 1. Channel 1 was used for the electric grid potential Ug and was set for Ug/10 output. Channel 2 was used for the Franck Hertz signal y-output. The oscilloscope was set to display an X-Y format. The retarding voltage, UE, was set to 0.4 V, the filament potential, UF, was set to 10.0 V and the grid potential, UG, was set to 5.2 V. The mode was switched to ramp, and the accelerating potential, UA min was set to 10.5 V and the UA max was set to 73.0 V, see figure 2. Using the ramp function, this allows the acceleration voltage to vary between 10.5 V and 73.0 V, allowing a range of voltages to be used giving a Franck Hertz curve of 5 peaks. The refresh rate was adjusted such that a solid curve was shown on the display, see figure 3. Results were then exported from the oscilloscope to an excel file.
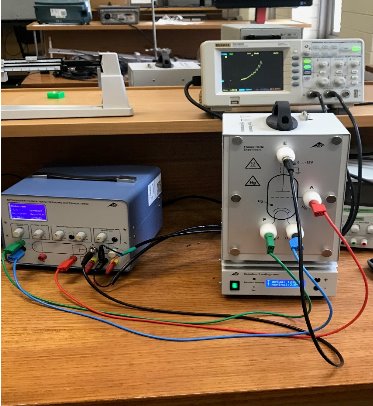
Figure 1. Experimental set up of Franck Hertz control unit (bottom left), heating oven at 210oC (bottom right) and the oscilloscope (top right).
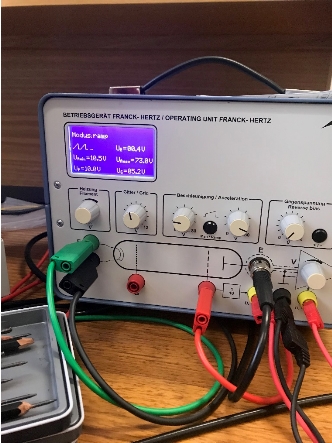
Figure 2. Franck Hertz control unit with UE set to 0.4 V, UF set to 10.0 V, UG, set to 5.2 V, UA min set to 10.5 V, UA max set to 73.0 V and mode set to ramp
 RESULTS
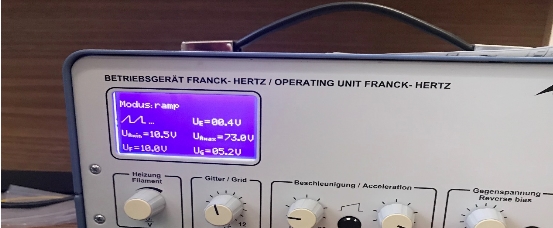
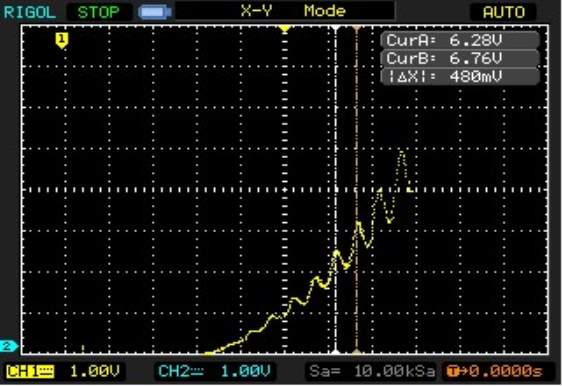
Figure 3. Franck Hertz curve showing 5 peaks, ignoring the peak relative to zero.

Figure 4. Franck Hertz control unit with UE set to 0.4 V, UF set to 10.0 V, UG, set to 5.2 V, UA min set to 10.5 V, UA max set to 73.0 V and mode set to ramp
Figure 5. Heating oven set to 210oC


 Figure 5. Graph of Results (See excel attachment for all data)
24.4 V
24.4 V
The first three peaks are not well defined and are excluded from the calculations. The first excitation potential of mercury was found to be 4.88 eV +,- 0.05 eV, using the equation,
(Vmin 5 – Vmin 1)/ No. of peaks
Gives,
(79.6 V – 55.2 V)/ 5 = 4.88 V
With an error of +,- 0.05 V
The emitted wavelength of the photon was 254.5 nm +,- 2.69 nm using the equations,
E = hc/λ
λ = hc/E
Gives,
λ = (4.14*10-15 * 3*108)/ 4.88
λ = 254.5 nm +- 2.69 nm
Error given by ((4.14*10-15 * 3*108)/ 4.93 – (4.14*10-15 * 3*108)/ 4.83)/2 = 2.69 nm
The calculated wavelength of the emitted photon is concordant with the measured wavelength using sensitive optical spectrometers.
BIBLIOGRAPHY
[1] PHY2MOD Franck Hertz experiment lab notes, Faculty of Science Technology & Engineering, La Trobe University
[2] G. Rapior, K. Sengstock, V. Baev, (2006). New features of the Franck-Hertz experiment. American Journal of Physics, 423-428.
Cite This Work
To export a reference to this article please select a referencing stye below:
Related Services
View all


DMCA / Removal Request
If you are the original writer of this essay and no longer wish to have your work published on UKEssays.com then please:


