 GBR
GBR Evaluation of Analytic Tools and Services for Business
| ✅ Paper Type: Free Essay | ✅ Subject: Information Technology |
| ✅ Wordcount: 2436 words | ✅ Published: 18th May 2020 |
Evaluation of Analytic Tools and Services for M.A.D.
Summary
The following report will discuss the impact of data analytics in organisation and what value can it bring to M.A.D. as an Internet Technology Company (assuming our company is, e.g. IoTs and Cloud Computing Services). Then, the report will present potential use of data analytics in three areas: Marketing, Human Resource/ Operation Management and Manufacturing/ Product Research and Development, each area will be interpreted with possible solution and/or suggestions in details followed by an example of techniques/tools being used in Uber and evaluating the benefits that the analysis will provide.
Table of Contents
Impact of Data Analytics in Organisations
Potential use of Data Analytics in Organisation
Techniques used for Data Analytics
Suggestions and Solutions for M.A.D.
State of Global Trend in Data Analytics
Introduction
With the advent of the era of big data and the rapid development of Internet technology, data is everywhere in the daily operation and management of enterprises. The summary, integration, analysis and research of all kinds of data play a very important role in the development and decision-making of enterprises. Correct data analysis with appropriate data analysing tools/services can help enterprises make wise business decisions on enterprise operations and bring long-term sustainable value growth to the organisation, like a no-risk investment with a great return.
If you need assistance with writing your essay, our professional essay writing service is here to help!
Essay Writing Service
Impact of Data Analytics in Organisations
The CTO of Insight Software Ltd – Craig Strong once wrote an article on Forbes Technology Council, briefly discussed about the impact of data analytics in organisation. Fundamentally, data analytics allows transformation of organisation from reactive environments (being managed by static and aged data) to an automatic and continuous learning environment. Real-time analysis, combined with leading indicators and KPIs (Key Performance Indicators), form a more robust understanding of data against the axis of time. Such capabilities enable decision-makers to find weak signals provisionally before it causes problems, providing longer preparations for corrective measures for outcomes that have not yet happened. This capability will create a distinction in earning or losing massive capital for an organization. [1]
Potential use of Data Analytics in Organisation
 Various types of data analytics will be involved in an organisation for each specific requirement in different areas. The following figure represents an example of data-analytics involve in health science/pharmaceutical industry.
figure 1 Analytics in Health Science/Pharmaceutical Companies
From above figure, we can see the adoption of various data analytics in health science industry divided to six categories, which cover a crossover of areas from: Marketing, Human Resources, Manufacturing, Competitor Analysis and Customer Analysis. M.A.D. as an internet technology company, shares a lot in common in the structure of data analytics usage with other industries like health science. A more similar example of data analytics usage will be internet technology service company like Uber. If Uber could be described as a person, data analytics will be the heart of that person. The following section will introduce the data analysing techniques and tools used for system logic of internet technology service with Uber as an example.

Techniques used for Data Analytics
figure 2 Uber real-time data analysing system
In Uber’s system, any user’s order entering the system will decide which driver to send the order to through a set of automatic server-side data analysing. For example, there are 20 passengers at the Auckland international airport and 30 drivers nearby, so which driver to send the order to? There are very complex algorithms behind it. The real-time data analysing system first carries out data analysis on drivers’ previous orders. Some drivers only take orders from familiar areas, some drivers frequently take orders from short distances, some drivers only take orders of $40 or above, and some drivers only take orders near home at night.
Through the data accumulation of data analysing system, it is found that the travel demand of users can also be predicted. The CBD area of Auckland, for example, assuming has a peak taxi ride at 10pm every Friday. All these demands are predicted through analysis of data accumulation, mining, analysis and prediction. The Uber system can predict where the demand for taxis is more or less in the next half hour, and whether the distribution of taxis is reasonable. If the demand for a taxi is unreasonable, the system automatically sends a message to the taxi driver, telling driver that someone is using the car nearby and an order will soon appear [3]. This is the iconic application of Uber in data analytics. If all Uber did before was to smooth out information asymmetry, it now making effort of affect transportation capacity with logical integrated techniques of data analytics.
For M.A.D., it will be beneficial to adopt similar data analysing techniques to optimise the service provide to customers and also saving cost of business operations, for instance, by using integrated techniques to analyse data in the various permutations, will able to simplify the advanced complex method of progress, to augment that experience to more quickly resolve or enhance a particular situation, and simultaneously optimise the network proactively by enabling digital thread which may leverage analytics to assist the machines optimise by themselves.
Suggestions and Solutions for M.A.D.
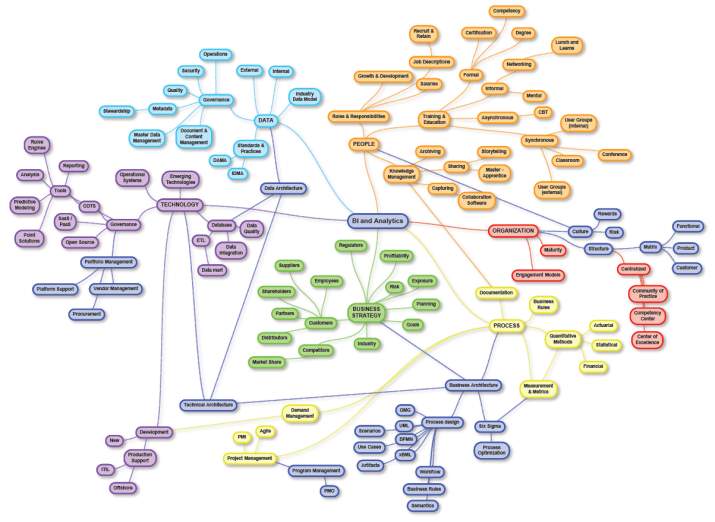 Based on keywords of data analytics, the following ‘logic map’ has been formed.
figure 3 Data Analytics Logic Map
This helped analyses and summarises the main aspects of the role that data analytic techniques will help on enterprises in following areas.
1. Marketing:
(1) Accurately find target users
Data mining technology is used to discover user characteristics, build user portraits, predict user behaviours, reasonably group users, predict user preferences, and make personalized recommendations.
(2) User behaviour research
User behaviour analysis research, for users’ multidimensional attributes, labels and behaviour data, user loss warning, user life cycle analysis, user influence analysis, user value analysis and other relevant user behaviour research.
(3) Industry competition and market monitoring
Monitor and analyse competitive products in the industry, collect and interpret relevant user and market research reports, and provide support for the company’s product planning.
2. Operation Management/Human Resource:
(1) Provide the latest operation situation
Make and maintain daily reports and data such as daily reports, weekly reports and monthly reports, even feedback the latest operation situation.
(2) Provide decision support for operation and management
Based on the operation of the company’s business to carry out in-depth analysis, put forward operational business development strategy recommendations.
(3) Monitor the effectiveness of operational activities
Monitor and analyse operational activities, evaluate operational effectiveness, propose marketing activity optimization and cost control solutions, and lead or assist in implementation.
(4) Team performance appraisal
Formulate corresponding performance appraisal scheme according to the overall KPI assessment and situation of the operation team and track the implementation of performance appraisal.
3. Product Research and Development (r & d)/Manufacturing
(1) Product optimization support
Conduct user analysis, revenue analysis, behaviour analysis and activity effect evaluation on relevant business line products and produce corresponding reports to provide support for product optimization and business operation.
(2) New product r & d support
Provide decision basis and direction for new product development according to existing data and realize data analysis and data product design required by business.
Suggestion for Analytic Tool:
Power BI by Microsoft
Gartner has ranked Microsoft as the Magic Quadrant leader for analytics and business intelligence platforms for 12 consecutive years. Here are the Magic Quadrant for Analytics and Business Intelligence Platforms in 2019:
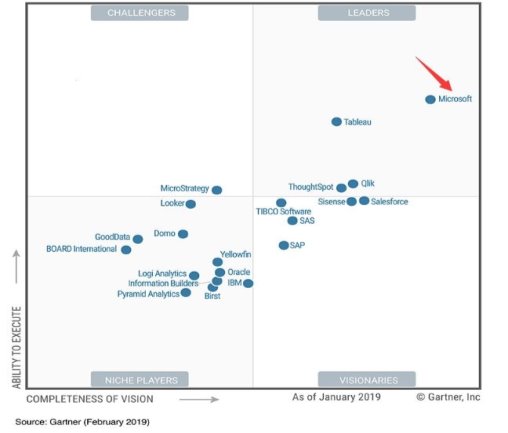
Because the Power BI Desktop is free to use and the Power BI Pro is available at a low price per user per month, can provide BI and analytics capabilities to everyone economically and efficiently to drive a data culture in your organization. Rapid development receives weekly and monthly updates based on thousands of ideas submitted annually by over 500,000 member communities worldwide to improve Power BI features and functions. Simple operation, easy to use Power BI so-called “noob” data analysis tools, easy to get started, suitable for data analysis as a starter tool. Power BI has a very rich library for analysts to choose, can make interactive reports, real-time data analysis, so that analysts can analyses the data at the same time, enjoy the feast of visualisation. Excel is the most widely used and widely used data analysis tool in the world. Power BI is its inheritance and derivation. It is an inevitable trend of future development from Excel to Power BI.
Our academic experts are ready and waiting to assist with any writing project you may have. From simple essay plans, through to full dissertations, you can guarantee we have a service perfectly matched to your needs.
View our servicesIn terms of data preparation tools, Power BI is very comprehensive. Microsoft designed a set of M language (also known as: Power Query M formula language) to support data preparation, M language learning is similar to VBA (Visual Basic for Applications, which is used in MS Office tools: Excel, Word and PowerPoint). With Power BI’s IDE (Integrated Development Environment) interface, analysts can easily perform many data cleansing tasks without writing a single line of code. Advanced users can even perform more complex data cleaning tasks by writing M code directly.
Reference
- [1] Strong, C. (2018, January). The Value Of Real-Time Data Analytics. Retrieved October, 2019, from https://www.forbes.com/sites/forbestechcouncil/2017/08/08/the-value-of-real-time-data-analytics/#31afd4eb1220.
- [2] Buluswar, M. (2016, April). How companies are using big data and analytics. Retrieved October, 2019, from https://www.mckinsey.com/business-functions/mckinsey-analytics/our-insights/how-companies-are-using-big-data-and-analytics.
- [3] Uber Engineering (2019) How Uber Uses Data to Improve Their Service. https://eng.uber.com/?s=Data+Analytics
- [4] Gartner. (2019, February) Magic Quadrant for Analytics and Business Intelligence Platforms. Retrieved from https://www.gartner.com/en/documents/3900992/magic-quadrant-for-analytics-and-business-intelligence-p
- [5] Minewiskan. (n.d.). Power Query M formula language reference – PowerQuery M. Retrieved from https://docs.microsoft.com/en-us/powerquery-m/index.
Appendices

 State of Global Trend in Data Analytics

Source: The 2020 Global State of Enterprise Analytics
Cite This Work
To export a reference to this article please select a referencing stye below:
Related Services
View all


DMCA / Removal Request
If you are the original writer of this essay and no longer wish to have your work published on UKEssays.com then please:


