 GBR
GBR Research into Technology Integration to Support STEM Learning
| ✅ Paper Type: Free Essay | ✅ Subject: Education |
| ✅ Wordcount: 4403 words | ✅ Published: 18th May 2020 |
Pair 01
Recently, interest in how to integrate technology into today’s K-12 STEM learning has been rising. When technology is used as a supportive tool in technology-integrated STEM classes, the learning sequence of technological skills can be a critical factor to overall instructional effectiveness. To respond to these demands, in the article “The impact of sequencing and prior knowledge on learning mathematics through spreadsheet,” Clarke, Ayres, and Sweller (2005) address how instructional sequencing between learning spreadsheet skills and mathematics impacts learning achievements and cognitive load, as well as how it interacts with students’ prior knowledge of spreadsheet skills based on the cognitive load theory framework (CLT, Sweller, Van Merrienboer, & Paas, 1998).
If you need assistance with writing your essay, our professional essay writing service is here to help!
Essay Writing ServiceTo tackle the above research question, the authors hypothesize that spreadsheets skills followed by mathematics instruction (i.e., sequential instruction) will help students with a low-level of spreadsheet skills gain more mathematics knowledge and a lower cognitive load (H1), while learning spreadsheets skills and mathematics together (i.e., concurrent instruction) will be more beneficial for a high-level of spreadsheet skills in mathematics knowledge and cognitive load (H2). To test the hypotheses, 24 high school students participated in the experiment and were assigned to one condition of 2×2 between factorial design, with instructional sequencing (sequential instruction vs. concurrent instruction) and with the level of prior knowledge on spreadsheet skills (high vs. low). The authors administered the treatment over four classes and then measured students’ mathematics knowledge, spreadsheet skills, and cognitive loads. The results showed that H1 was supported in that, for the low prior knowledge group, concurrent instruction was less effective than sequential instruction in the mathematics test scores and cognitive loads. However, H2 was partially supported by the result that the high prior knowledge group perceived significantly lower cognitive loads during sequential instruction, but there was no significant difference between the two instructional methods in mathematics learning. While the findings of the study have practical implications for technology integration, especially in terms of research design, there are several issues to threat validity, which weaken the study’s findings.
Based on the definition of Cook and Campbell (1979), internal validity focuses on the relationship between cause and effect, and it is threatened when the treatments fail to make a difference in outcome variables. First, in order to minimize internal validity threats, the authors assigned participants to sequential and concurrent instruction groups using matching. Considering that the goal of matching is to control potential confounding effects (Shadish, Cook, & Campbell, 2002), matching criteria should be selected to the variables that are highly correlated to treatments or outcomes. The school-based ranking utilized by this study as the matching criteria was a proxy for students’ overall academic achievement, and not directly related to their mathematics knowledge or spreadsheet skills. This issue could be a potential factor in the selection problem. In a similar vein, in order to determine whether the high and lower prior knowledge groups differed, the authors used the results of a self-assessment on the spreadsheet skills instead of utilizing performance-based measures. These types of measurements tend to be inaccurate, especially for K-12 students, and, if the participants were assigned based on inaccurate criteria, then it would pose a serious threat to internal validity. To make matters worse, the small sample size of each group (average: 5) could lessen the effectiveness of matching. Diehr, Martin, Kopsell, and Cheadle (1995) state that, if the sample size of the group is too small (e.g., less than 10), then the effect of matching is null, or even weakening to statistical power. This means that the use of matching in this study did not work and, perhaps, even worsened the quality of the overall findings by threatening internal validity.
Moreover, with regards to differential attrition, the study reported that three participants in the sequential instruction and one student in the concurrent instruction were excluded in the analysis stage due to dropping out during experiments. However, the authors did not present any explanation about the background information or learning trajectories of the missing data, and they instead ruled them out, without any theoretical and statistical consideration. Moreover, since the authors used matching in the process of assignment, they should have been more cautious about the handling of the paired data of missing one. Maturation and history were also not discovered in this study, as the experiment was conducted within a relatively short duration. Furthermore, there was no evidence of the testing effect, since participants took only one post-test after treatment.
The threats to statistical conclusion validity, based on the definition of Cook and Campbell (1979), were concerned with whether the reasoning of the causal effects could be justified based on the statistical approaches. The first threat is low statistical power. In this study, there were no clues to conduct power analysis. Considering that the sample number of each group was 5 and that the total number of samples was 20, it is presumed that this study has very low statistical power. Moreover, after excluding the missing data, the proportion between sequential groups (n=9) and concurrent groups (n=11) was unbalanced, which could have led to lower statistical power (Saddish, Cook, & Campbell, 2002). As for the violation of statistical assumption, a two-way ANOVA was conducted: however, the authors did not report information on their statistical assumptions. Lastly, this study used parametric statistics, which means that the distribution of each data set should be fully satisfied with the normality assumption (Cohen, 2008). However, considering the small sample size and no evidence of the normality assumption, nonparametric statistics could have been a more desirable way to analyze data than parametric statistics. There was also no evidence of p-hacking, since the test was conducted just one time. In addition, there was no evidence of restriction of range, non-systematic manipulation, and extraneous variance in this paper.
According to Cook and Campbell (1979), the threats to construct validity are related to whether the constructs are well-defined and precisely operationalized in the research context. One of the biggest threats to construct validity is that the authors did not report on the validity or the reliability of measurements used in the study. This makes the quantitative data from the study unreliable and weakens the value of overall results. Not only that, in terms of inadequate explication of constructs, the operational definition of cognitive load and its constructs did not match the measurement of cognitive load. In the literature review, the authors elaborated on the definition of cognitive load and identified three different sub-constructs: intrinsic cognitive load, extraneous cognitive load, and germane cognitive load. These three sub-constructs have their own psychometrical characteristics, and recent studies have reported that these different types of cognitive load can be differentiated and measured through well-validated instruments (Leppink, Paas, Van de Vleuten, Van Gog, & Van Merrienboer, 2013). Nevertheless, cognitive load measures used in this study consist of only one item, which aggregated the three sub-constructs of cognitive load to just one value. The problem is that the one-item measurement failed to detect the multifaceted characteristics of cognitive load. Regarding the measurements of cognitive load, the authors collected participants’ cognitive load right after the test, and not after treatment. Considering the operational definition of the cognitive load as the cognitive burden experienced by participants during the treatments, it is right to ask them their degree of cognitive load during, or immediately after, treatment. These threats come from the fact that the authors failed to analyze the fundamental features of cognitive load. Another threat to construct validity is the mono-method. While the mathematics test assessed the whole sub-skills of mathematics using various instructional tools (e.g., pen, paper, and calculator), the cognitive load used a one-item, self-reported questionnaire. Using just one method to measure the construct led to the weakening of the construct validity, as well as to the inflation of measurement errors. There was no evidence of construct confounding, because the shared variance between cognitive load and mathematics knowledge was relatively low.
According to Cook and Campbell (1979), threats to external validity are concerned with whether the results of the study can be generalized to the targeted population. One of the key issues to threat external validity is that the participants cannot be generalized to the targeted population. All participants in the study were from a boy’s high school located in the Sydney metropolitan area in the Western country of Australia. The characteristics of the sample are thus severely biased, as they represent the preferred workforce in the field of STEM. As for the inequality in STEM, Searle and Kafai (2015) comment not only on the discrimination of gender, race, and ethnicity in STEM areas, which has been prevalent for a long time, but also on what attention is needed to design pedagogical affordance to lower barriers against underrepresented groups. Considering that females and members of non-dominant races and ethnicities account for merely 12% of STEM professionals, the results from the biased sample cannot be generalized to the intended population.
Pair 02
As the use of technology as a supportive tool has been more prevalent in today’s STEM learning, many researchers and practitioners have given attention to when and how to use the technology in learning and teaching practices. Clarke et al (2005) examine how the timing of learning technology and prior knowledge of technological knowledge impact the domain subject contents and cognitive load. The study provides practical implications that instructional sequencing should be differentiated according to the technological expertise of students in technology-integrated STEM courses. However, several potential weaknesses of this study threaten the validity of the study as follows: non-generalizability to the targeted population, selection, differential attrition, low statistical power, violated assumptions of statistical testing, inadequate explications of constructs, a lack of reporting on reliability and validity, and mono-method. All these threats to validity lessen the value of the study’s findings. Based on these pointed issues, the current chapter will address how to minimize, or prevent, potential threats to validity in the stage of research design.
To deal with threats to external validity, the sample will reflect the diversity of race, gender, and ethnicity by using a clear recruitment strategy. In line with the biased sample, Ceci and Williams (2012) insist that continuing research practices, based on a biased view of gender and ethnicity, intensify the shortage of underrepresented groups among STEM professionals. This raises the necessity of concentrating on sampling in a holistic way in order to reflect ethnic minorities and females. However, Searle and Kafai (2015) suggest that, since the number of the target group (e.g., American Indian girls) is relatively few, efforts to understand their learning trajectories and transformative career changes to STEM fields through qualitative approaches (e.g., ethnography) are also needed. Thus, to generalize the findings to the population, future research should draw more attention to the crossing points of gender, race, and ethnicity in STEM education in order to collect data in a multifaceted way that does not distinguish between qualitative and quantitative approaches.
To remedy the selection problem, the authors will use improved random assignment strategies. Matching is one of the good alternatives to ensure random assignment, but it did not work in the study due to its faulty application. First, the authors should have explored the confounding variable (e.g., the pre-test of mathematics knowledge) and have used it as a matching variable. To ensure random assignment, as suggested by Shadish et al (2002), the authors should consider conducting matching based on clear matching criteria and controlling matching variables as covariates at the same time. As for differential attrition, the authors should solve this issue by conducting oversampling in the treatment condition. Then, no matter how many attritions have occurred, the authors could still determine whether treatments work in the study. Moreover, in that this study used matching, when the authors handled missing values, they made a reasonable decision to rule out paired data together or to impute new values based on the missing data’s information.
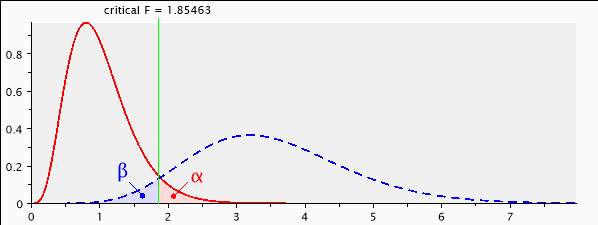
As for low statistical power, based on the information presented in the paper, a priori power can be calculated to check an appropriate sample size. According to the G power 3.1 (Faul, Erdfelder, Lang, & Buchner, 2007), a prior F-test with α=0.05, power (1-β) = 0.95, small to medium effect-size
=0.25, and numbers of group=4 (2×2 between factorial design) need a sample size of 400 (see appendix A). This means that the authors should collect at least 400 participants and 100 participants for each group in order not to violate statistical conclusion validity. After conducting the power analysis, the author should check statistical assumptions in order to use parametric statistics. Prior to conducting univariate ANOVA, three assumptions will be established to test the reliability of the parametric statistical test as follows: 1) normality, 2) independence, and 3) homogeneity. To assess statistical tests for normal distribution assumption, the Shapiro-Wilk normality test will be used, which is typically evaluated at a stringent alpha level of .01 (Stevens, 2009). Furthermore, the Z-value of skewness and kurtosis values will be computed, and its critical value is commonly more than plus and minus 2.58, which corresponds to a .01 alpha level (Hair, Black, Babin, & Anderson, 2010). Second, independence assumptions will be satisfied, if participants have been randomly assigned to treatment groups or conditions of the study (Stevens, 2009). Lastly, Levene’s test will be performed to verify the assumption of homogeneity of variance for each of the dependent variables. If all assumptions are satisfied, then parametric statistical analysis should be conducted (Cohen, 2008).
Lastly, to deal with threats to construct validity, the author will use well-validated and well-operational defined instruments, instead of using self-assessment. To measure cognitive loads, for example, this study will use a ten-item questionnaire developed by Leppink et al (2013). This instrument consists of 10 items to measure three sub-constructs of cognitive load (see appendix B), and many studies have reported that this instrument is relatively sensitive to variations in each category of cognitive load and presents satisfactory reliability (Cronbach’s α), ranging from .63 to .96 (Leppink et al., 2013; Leppink, Paas, Van Gog, & Van der Vluenten, 2014; McLaren, Van Gog, Ganoe, Karabinos, & Yaron, 2016). If the measurement of mathematics knowledge and cognitive loads are selected, the authors will check its reliability and validity. To analyze the reliability of the multiple-choice type of measurement (e.g., the measure of cognitive loads), Cronbach’s α will be estimated. To analyze the reliability of the short-term answers (i.e., mathematics and spreadsheets skills knowledge), inter-rater reliability analysis using Cohen’s κ will be performed to determine consistency among different raters. For testing the construct validity of cognitive load, confirmatory factor analysis (CFA) will be conducted; for checking the criterion validity of mathematics knowledge and spreadsheets skills, such test scores will be correlated to well-calibrated existing test scores (e.g., the national level of standardized test). Additionally, to tackle mono-method issues in the measure of cognitive load, if more validated physiological measurements (e.g., fMRI or eye-tracking; Anmarkrud, Andresen, & Bråten, 2019) are utilized or various measurement are administrated concurrently, these solutions would prevent the threats to construct validity.
The previously enumerated remedies will ensure that the research design remains robust against potential validity threats. Nonetheless, the study may still have some limitations. For example, according to the results of power analysis, the study would require 400 participants in order to generalize its findings to the general population. Yet, it remains doubtful whether the study can be designed in such a way that a sufficiently large number of participants can be adequately controlled. Therefore, there exists an evident tension between internal validity and external validity. Moreover, the short duration of the study (i.e., four classes) was too short to enhance mathematics knowledge. This fact highlights the need for longitudinal studies, which could better enhance knowledge about both the impact of technology as a support tool for STEM learning and other potential contributing factors to STEM education.
In terms of content, the study evidences a limitation in its firm situation in human cognitive architecture and cognitive load theory (Sweller et al, 1998), which precludes a consideration of the impact of non-cognitive factors on learning achievements. According to large-scale data-driven research, non-cognitive factors in mathematics (i.e., math self-efficacy, math motivation, and math anxiety) account for the most substantial variance in mathematics performance in PISA data (Stankov, & Lee, 2014). In order to account for this reality, future research should control for motivational and affective factors among students in order to examine the impact of cognitive treatment of learning performance.
References
- Anmarkrud, Ø., Andresen, A., & Bråten, I. (2019). Cognitive load and working memory in multimedia learning: Conceptual and measurement issues. Educational Psychologist, 54(2), 61-83. doi: 10.1080/00461520.2018.1554484
- Ceci, S. J., & Williams, W. M. (2010). Sex differences in math-intensive fields. Current Directions in Psychological Science, 19(5), 275–279. doi: 10.1177/0963721410383241
- Clarke, T., Ayres, P., & Sweller, J. (2005). The impact of sequencing and prior knowledge on learning mathematics through spreadsheet applications. Educational Technology Research and Development, 53(3), 15-24. doi: 10.1007/BF02504794
- Cohen, B. H. (2008). Explaining Psychological Statistics (4th ed.). New York, NY: John Wiley & Sons, Inc.
- Cook, T. D., & Campbell, D. T. (1979). Quasi-experimentation: Design and analysis issues for field settings. Boston, MA: Houghton Mifflin Company.
- Diehr, P., Martin, D. C., Koepsell, T., & Cheadle, A. (1995). Breaking the matches in a paired t‐test for community interventions when the number of pairs is small. Statistics in Medicine, 14(13), 1491-1504. doi: 10.1002/sim.4780141309
- Faul, F., Erdfelder, E., Lang, A., & Buchner, A. (2007) G*Power 3: A flexible statistical power analysis program for the social, behavior, and biomedical sciences. Behavior Research Method, 39(2), 175-191. doi: 10.3758/BF03193146
- Hair, J. F., Black, W. C., Babin, B. J., & Anderson, R. E. (2010). Multivariate data analysis. Upper Saddle River, NJ: Prentice Hall.
- Leppink, J., Paas, F., Van der Vleuten, C. P., Van Gog, T., & Van Merriënboer, J. J. (2013). Development of an instrument for measuring different types of cognitive load. Behavior Research Methods, 45(4), 1058-1072. doi: 10.3758/s13428-013-0334-1
- Leppink, J., Paas, F., Van Gog, T., Van Der Vleuten, C. P., & Van Merriënboer, J. J. (2014). Effects of pairs of problems and examples on task performance and different types of cognitive load. Learning and Instruction, 30, 32-42. doi: 10.1016/j.learninstruc.2013.12.001
- McLaren, B. M., van Gog, T., Ganoe, C., Karabinos, M., & Yaron, D. (2016). The efficiency of worked examples compared to erroneous examples, tutored problem solving, and problem-solving in computer-based learning environments. Computers in Human Behavior, 55(Part A), 87-99. doi: 10.1016/j.chb.2015.08.038
- Searle, K. A., & Kafai, Y. B. (2015). Culturally Responsive Making with American Indian Girls: Bridging the Identity Gap in Crafting and Computing with Electronic Textiles. Proceedings of the Eleventh Annual International Conference on International Computing Education Research (pp. 31–39). New York, NY: Association for Computing Machinery (ACM). doi: 10.1145/2807565.2807707
- Shadish, W. R., Cook, T. D., & Campbell, D. T. (2002). Experimental and quasi-experimental designs for generalized causal inference. Boston, MA: Houghton Mifflin.
- Stevens, J. (2009). Applied multivariate statistics for the social sciences (5th ed). Mahwah, NJ: Lawrence Erlbaum Publishers.
- Sweller, J., van Merrienboer, J. J G., & Paas, F. (1998). Cognitive architecture and instructional design. Educational Psychology Review, 10(3), 251-296. doi: 10.1023/A:1022193728205
- Stankov, L., & Lee, J. (2014). Quest for the best non-cognitive predictor of academic achievement. Educational Psychology, 34(1), 1-8. doi: 10.1080/01443410.2013.858908
Appendix A. A priori power analysis
[1] — Saturday, September 28, 2019 — 19:38:48
F tests – ANOVA: Fixed effects, special, main effects and interactions
Analysis: A priori: Compute required sample size
Input: Effect size f = 0.25
α err prob = 0.05
Power (1-β err prob) = 0.95
Numerator df = 10
Number of groups = 4
Output: Noncentrality parameter λ = 25.0000000
Critical F = 1.8546311
Denominator df = 396
Total sample size = 400
Actual power = 0.9504322
Figure A.1. The result of priori power analysis
Appendix B. Ten-item questionnaire for the measurement of cognitive load
Table B.1. Questionnaire for the measurement of cognitive load
|
|
Items |
|
Intrinsic cognitive load (α=.89) |
The topic/topics covered in the activity was/were very complex. The activity covered formulas that I perceived as very complex. The activity covered concepts and definitions that I perceived as very complex. |
|
Extraneous cognitive load (α=.63) |
The instructions and/or explanations during the activity were very unclear. The instructions and/or explanations were, in terms of learning, very ineffective. The instructions and/or explanations were full of unclear language. |
|
Germane cognitive load (α=.96) |
The activity really enhanced my understanding of the topic(s) covered. The activity really enhanced my knowledge and understanding of statistics. The activity really enhanced my understanding of the formulas covered. The activity really enhanced my understanding of concepts and definitions. |
Note. Participants responded to all self-report items in this study on an 11-point Likert-type scale from 0 meaning not at all the case and 10 meaning completely the case.
Cite This Work
To export a reference to this article please select a referencing stye below:
Related Services
View all


DMCA / Removal Request
If you are the original writer of this essay and no longer wish to have your work published on UKEssays.com then please:


